Note
Click here to download the full example code
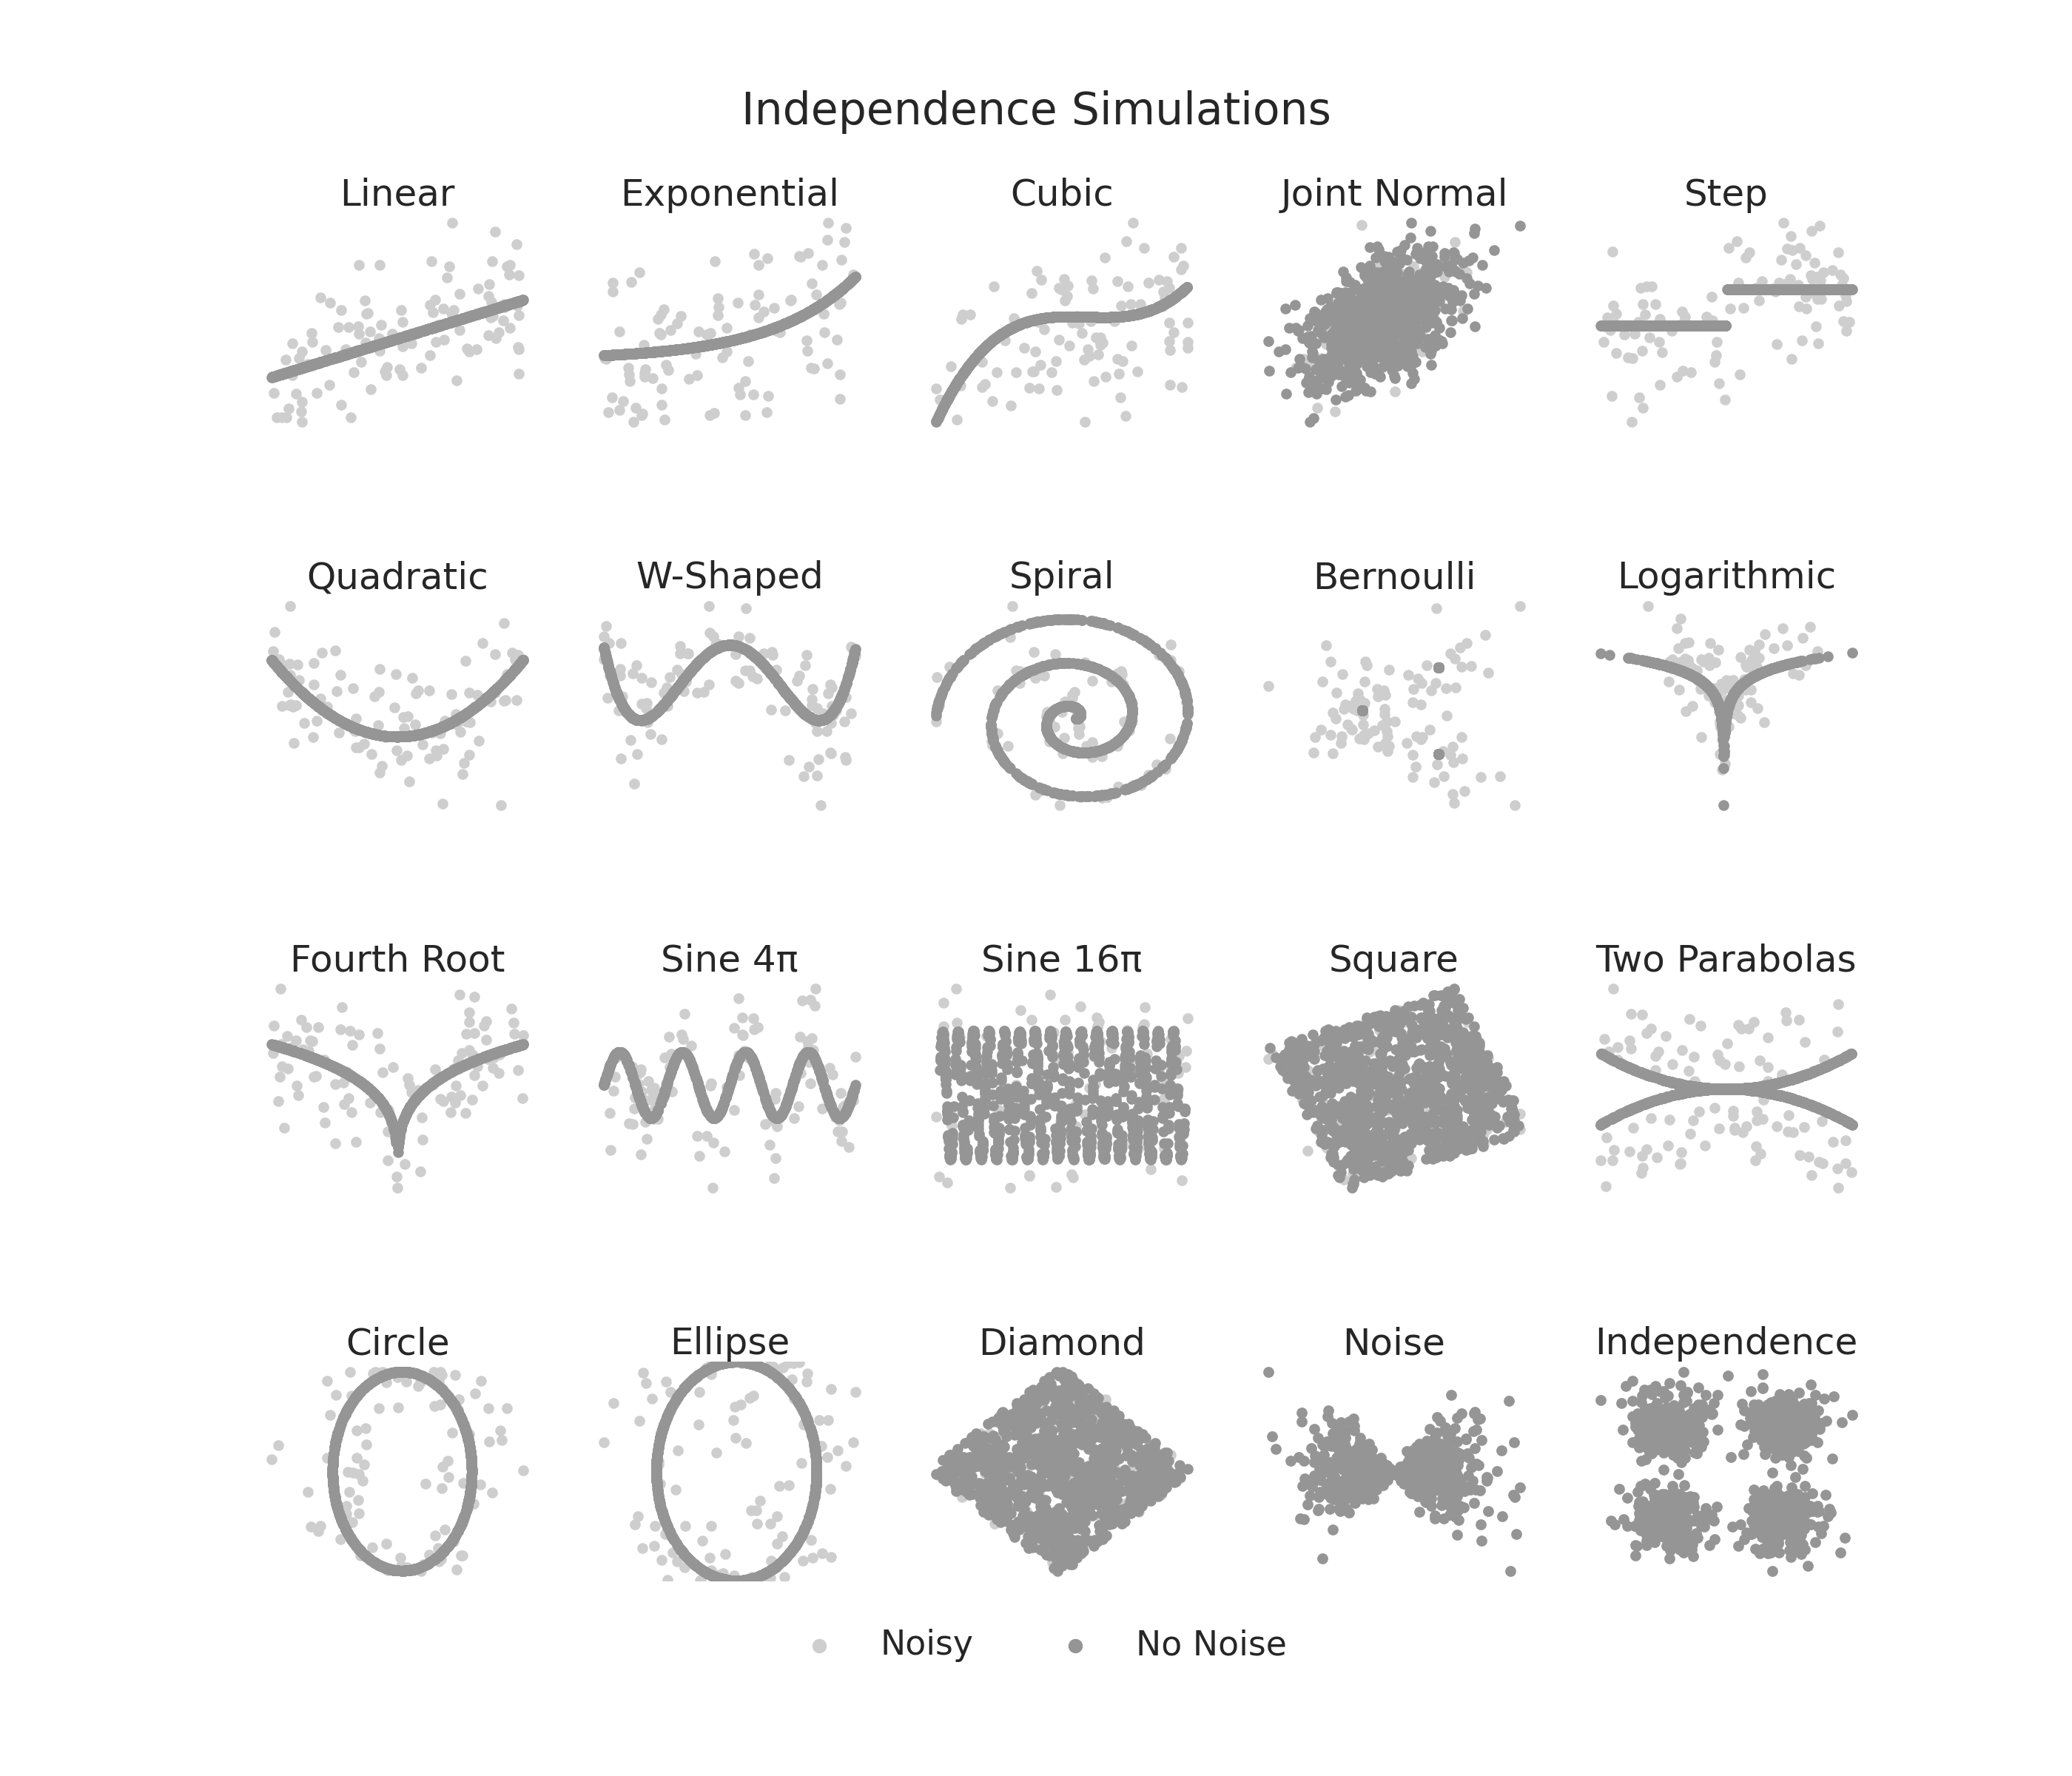
Independence Sims
Independence simulations are found in hyppo.tools. Here, we visualize what these
simulations look like. Noise-free simulations are overlaid over the noisy simulation.
Note that the last 2 simulations have no noise parameter. These simulations were chosen
as an aggregate of many popularly tested equations in the literature.
import matplotlib.pyplot as plt
import seaborn as sns
from hyppo.tools import SIMULATIONS

# make plots look pretty
sns.set(color_codes=True, style="white", context="talk", font_scale=2)
PALETTE = sns.color_palette("Greys", n_colors=9)
sns.set_palette(PALETTE[2::2])

# constants
NOISY = 100  # sample size of noisy simulation
NO_NOISE = 1000  # sample size of noise-free simulation

# simulation titles
SIM_TITLES = [
    "Linear",
    "Exponential",
    "Cubic",
    "Joint Normal",
    "Step",
    "Quadratic",
    "W-Shaped",
    "Spiral",
    "Bernoulli",
    "Logarithmic",
    "Fourth Root",
    "Sine 4\u03C0",
    "Sine 16\u03C0",
    "Square",
    "Two Parabolas",
    "Circle",
    "Ellipse",
    "Diamond",
    "Noise",
    "Independence",
]


# make a function that runs the code depending on the simulation
def plot_sims():
    """Plot simulations"""
    fig, ax = plt.subplots(nrows=4, ncols=5, figsize=(28, 24))

    plt.suptitle("Independence Simulations", y=0.93, va="baseline")

    for i, row in enumerate(ax):
        for j, col in enumerate(row):
            count = 5 * i + j
            sim_title = SIM_TITLES[count]
            sim = list(SIMULATIONS.values())[count]

            # the multiplicative noise and independence simulation don't have a noise
            # parameter
            if sim_title in ["Noise", "Independence"]:
                x, y = sim(NO_NOISE, 1)
                x_no_noise, y_no_noise = x, y
            else:
                x, y = sim(NOISY, 1, noise=True)
                x_no_noise, y_no_noise = sim(NO_NOISE, 1)

            # plot the noise and noise-free sims
            col.scatter(x, y, label="Noisy")
            col.scatter(x_no_noise, y_no_noise, label="No Noise")

            # make the plot look pretty
            col.set_title("{}".format(sim_title))
            col.set_xticks([])
            col.set_yticks([])
            if count == 16:
                col.set_ylim([-1, 1])
            sns.despine(left=True, bottom=True, right=True)

    leg = plt.legend(
        bbox_to_anchor=(0.5, 0.1),
        bbox_transform=plt.gcf().transFigure,
        ncol=5,
        loc="upper center",
    )
    leg.get_frame().set_linewidth(0.0)
    for legobj in leg.legend_handles:
        legobj.set_linewidth(5.0)
    plt.subplots_adjust(hspace=0.75)


# run the created function for the simultions
plot_sims()
Total running time of the script: ( 0 minutes 0.652 seconds)