Note
Click here to download the full example code
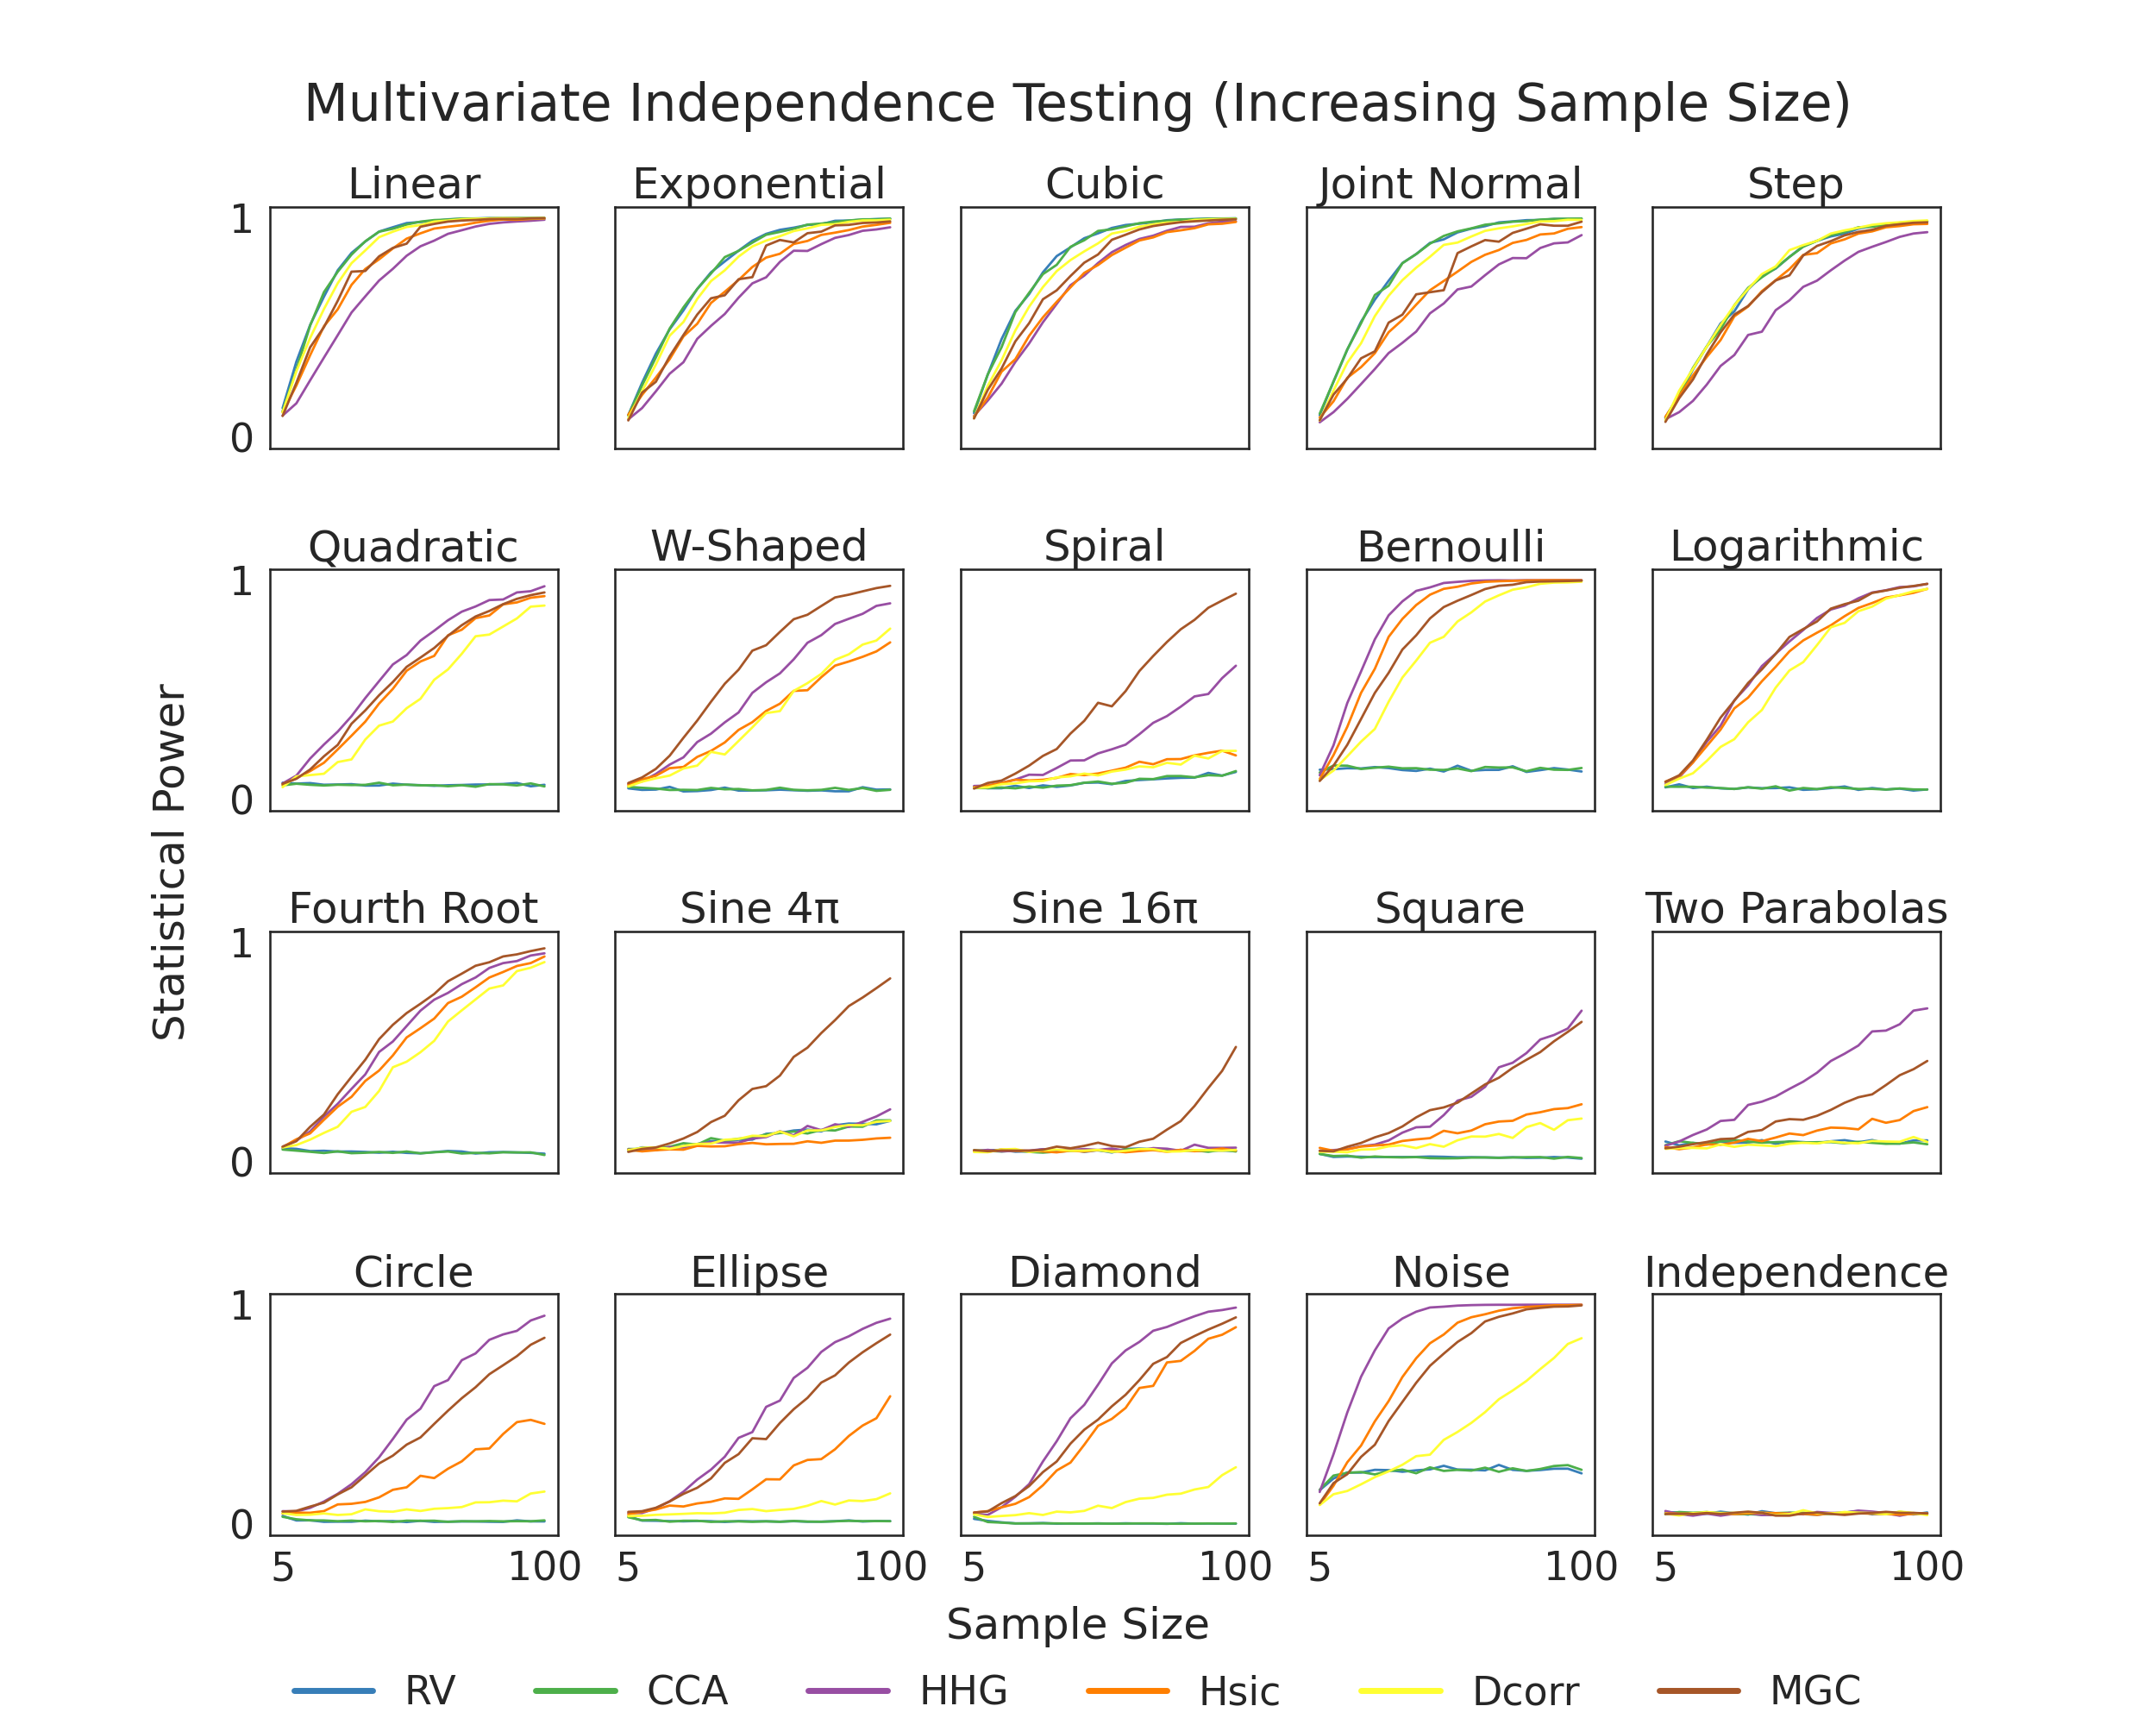
1D Independence Testing Power vs. Sample Size
Here, we show finite testing power comparisons between the various tests within hyppo. For a test to be consistent, we would expect power to converge to 1 as sample size increases. Tests that converge to 1 quicker have higher finite testing power and are likely better to use for your use case. The simulation in the bottom right is used so that we know that we are properly controlling for type I error, which is important becase otherwise the test would be invalid (power = alpha-level = 0.05).
import os
import sys

import matplotlib.pyplot as plt
import numpy as np
import seaborn as sns
from hyppo.independence import INDEP_TESTS
from hyppo.tools import SIMULATIONS, power
from joblib import Parallel, delayed

sys.path.append(os.path.realpath(".."))

# make plots look pretty
sns.set(color_codes=True, style="white", context="talk", font_scale=2)
PALETTE = sns.color_palette("Set1")
sns.set_palette(PALETTE[1:])

# constants
MAX_SAMPLE_SIZE = 100
STEP_SIZE = 5
SAMP_SIZES = range(5, MAX_SAMPLE_SIZE + STEP_SIZE, STEP_SIZE)
POWER_REPS = 5

# simulation titles
SIM_TITLES = [
    "Linear",
    "Exponential",
    "Cubic",
    "Joint Normal",
    "Step",
    "Quadratic",
    "W-Shaped",
    "Spiral",
    "Bernoulli",
    "Logarithmic",
    "Fourth Root",
    "Sine 4\u03C0",
    "Sine 16\u03C0",
    "Square",
    "Two Parabolas",
    "Circle",
    "Ellipse",
    "Diamond",
    "Noise",
    "Independence",
]

# these tests only make sense for > 1 dimension data
remove = ["maxmargin", "kmerf", "friedman_rafsky"]
INDEP_TESTS = dict([(k, v) for k, v in INDEP_TESTS.items() if k not in remove])


def estimate_power(sim, test, auto=False):
    """Compute the mean of the estimated power of 5 replications over sample sizes."""
    if test == "MaxMargin":
        test = ["MaxMargin", "Dcorr"]
    est_power = np.array(
        [
            np.mean(
                [
                    power(
                        test, pow_type="indep", sim=sim, n=i, p=1, auto=auto, noise=True
                    )
                    for _ in range(POWER_REPS)
                ]
            )
            for i in SAMP_SIZES
        ]
    )
    np.savetxt(
        "../benchmarks/vs_samplesize/{}_{}.csv".format(sim, test),
        est_power,
        delimiter=",",
    )

    return est_power


# At this point, we would run this bit of code to generate the data for the figure and
# store it under the "vs_sampsize" directory. Since this code takes a very long time,
# we have commented out these lines of codes. If you would like to generate the data,
# uncomment these lines and run the file.
#
# outputs = Parallel(n_jobs=-1, verbose=100)(
#     [
#         delayed(estimate_power)(sim_name, test)
#         for sim_name in SIMULATIONS.keys()
#         for test in INDEP_TESTS.keys()
#     ]
# )


def plot_power():
    fig, ax = plt.subplots(nrows=4, ncols=5, figsize=(25, 20))
    plt.suptitle(
        "Multivariate Independence Testing (Increasing Sample Size)",
        y=0.93,
        va="baseline",
    )

    for i, row in enumerate(ax):
        for j, col in enumerate(row):
            count = 5 * i + j
            sim = list(SIMULATIONS.keys())[count]

            for test in INDEP_TESTS.keys():
                est_power = np.genfromtxt(
                    "../benchmarks/vs_samplesize/{}_{}.csv".format(sim, test),
                    delimiter=",",
                )

                col.plot(SAMP_SIZES, est_power, label=INDEP_TESTS[test].__name__, lw=2)
                col.set_xticks([])
                if i == 3:
                    col.set_xticks([SAMP_SIZES[0], SAMP_SIZES[-1]])
                col.set_ylim(-0.05, 1.05)
                col.set_yticks([])
                if j == 0:
                    col.set_yticks([0, 1])
                col.set_title(SIM_TITLES[count])

    fig.text(0.5, 0.05, "Sample Size", ha="center")
    fig.text(
        0.07,
        0.5,
        "Statistical Power",
        va="center",
        rotation="vertical",
    )
    leg = plt.legend(
        bbox_to_anchor=(0.5, 0.05),
        bbox_transform=plt.gcf().transFigure,
        ncol=len(INDEP_TESTS.keys()),
        loc="upper center",
    )
    leg.get_frame().set_linewidth(0.0)
    for legobj in leg.legend_handles:
        legobj.set_linewidth(5.0)
    plt.subplots_adjust(hspace=0.50)


# plot the power
plot_power()
Total running time of the script: ( 0 minutes 0.703 seconds)