Note
Click here to download the full example code
Overview
hyppo is a multivariate hypothesis testing package, dealing with problems such as independence testing, k-sample testing, time series independence testing, etc. It includes algorithms developed by the neurodata lab as well as relevant important tests within the field.
The primary motivation for creating hyppo was simply the limitations of tools that data scientists are afforded in Python, which then leads to complex workflows using other languages such as R or MATLAB. This is especially true for hypothesis testing, which is a very important part of data science.
Conventions
Before we get started, here are a few of the conventions we use within hyppo:
All tests are releagted to a single class, and all classes have a
testmethod. This method returns a test statistic and p-value, as well as other informative outputs depending on the test. We recommend using this method, though a statistic method exists that just returns the test statistic.All functions and classes accept
numpy.ndarrayas inputs. Optional inputs vary between tests within the package.Input data matrices have the shape
(n, p)where n is the number of samples and p is the number of dimensions (or features)
The Library
Most classes and functions are available through the hyppo top level package,
though our workflow generally involves importing specific classes or methods from our
modules.
Our goal is to create a comprehensive hypothesis testing package in a simple and easy
to use interface. Currently, we include the following modules:
hyppo.independence, hyppo.ksample, hyppo.time_series,
hyppo.discrim and
hyppo.tools. The last of which does not contain any tests, but functions to
generate simulated data, that we used to evalue our methods, as well as functions to
calculate p-values or other important functions commmonly used between modules.
General Workflow
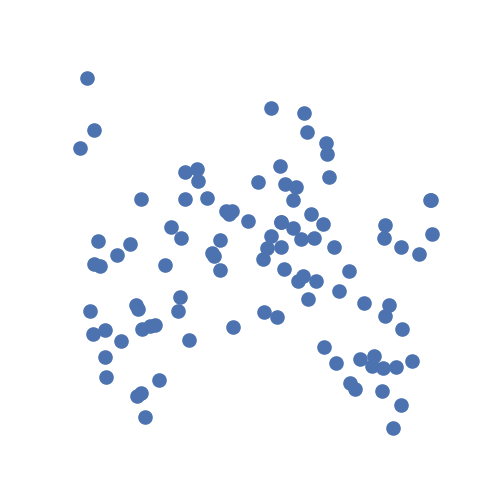
As an example, let's generate some simulated data using hyppo.tools.w_shaped:
from hyppo.tools import w_shaped

# 100 samples, 1D x and 1D y, noise
x, y = w_shaped(n=100, p=1, noise=True)
The data are points simulating a noisy spiral relationship between random variables
\(X\) and \(Y\) and returns realizations as numpy.ndarray:
import matplotlib.pyplot as plt
import seaborn as sns

# make plots look pretty
sns.set(color_codes=True, style="white", context="talk", font_scale=1)

# look at the simulation
plt.figure(figsize=(5, 5))
plt.scatter(x, y)
plt.xticks([])
plt.yticks([])
sns.despine(left=True, bottom=True, right=True)
plt.show()

Let's ask the question: are x and y independent? From the description given
above, the answer to that is obviously no.
From the simulation visualization, it's hard to tell.
We can verify whether or not we can see a trend within the data by
running an independence test. Let's use the test multiscale graph correlation
(MGC)
which, as an aside, was the test that started the creation of the package.
We have to import it, and then run the test.
First, we initalize the class. Most tests have a compute_distance parameter that
can use accept any metric from sklearn.metric.pairwise_distances
(or sklearn.metrics.pairwise.pairwise_kernels for kernel-based methods)
and additional keyword arguments for the method.
The parameter can also accept a custom function, or None in the case where the
inputs are already distance matrices.
Each test also has a test method that has a
reps parameter that controls the replications of
hyppo.tools.perm_test and the workers parameter controls the number of
threads when running the parallelized code (-1 uses all available cores). We
highly recommend using a number >= 1 in general since speed increases are noticeable.
from hyppo.independence import MGC

stat, pvalue, mgc_dict = MGC().test(x, y)
print(stat, pvalue)
Out:
0.1130219549131264 0.001998001998001998
Note: MGC, like some tests, have 3 outputs. In general, tests in
hyppo.independence have 2 outputs.
We see that we are right! Since the p-value is less than the alpha level of 0.05, we can conclude that random variables \(X\) and \(Y\) are dependent (and reject the null hypothesis that they are independent). And that's it!
Wrap Up
This covers the basics of using most tests in hyppo. Most use cases and examples in the documentation will involve some variation of the following workflow:
Load your data and convert to
numpy.ndarrayImport the desired test
Run the test on your data
Obtain a test statistic and p-value (among other outputs)
Total running time of the script: ( 0 minutes 4.065 seconds)